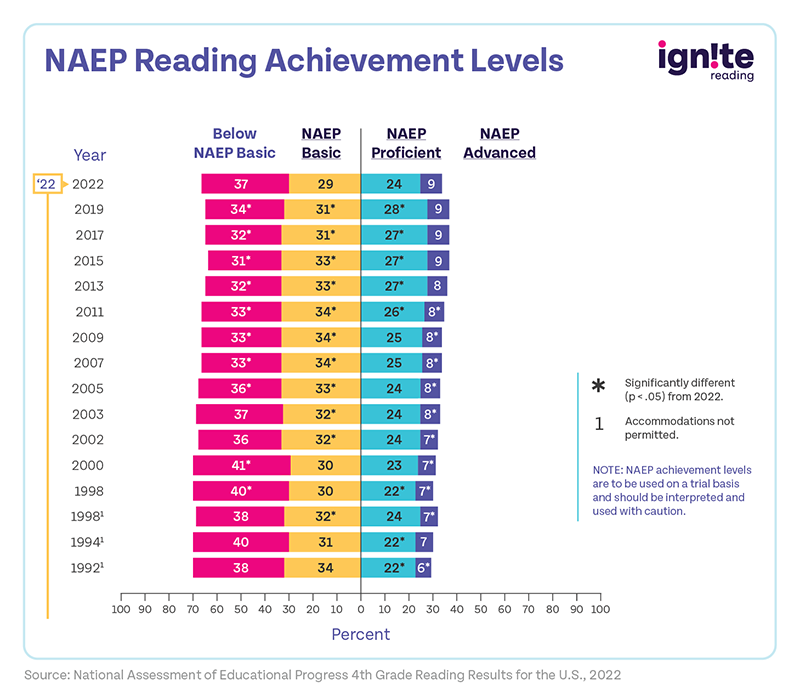
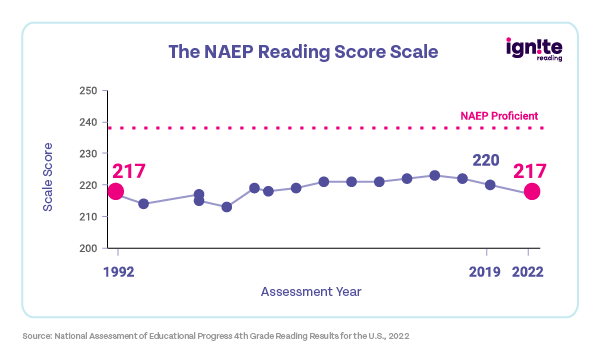
The 2024 National Assessment of Educational Progress (NAEP) scores have revealed what educators feared — 4th and 8th grade reading test results have continued to slide downward.
These are the first national reading results to come out since a 2022 report showed average reading scores were continuing a downward trend that began more than a decade prior. Average 2024 results for both 4th graders and 8th graders are 2 points lower than the 2022 scores.
The Nation’s Report Card also revealed a 5 point dip from a pre-pandemic test administered in 2019. Perhaps most troubling? Students performing at the lowest level — below basic proficiency — in both 4th and 8th grades posted the worst reading scores in more than 30 years.
What do these test results mean? And what are the newly added student demographic measures educators should be looking at?
We took a deep dive into the 2024 scores, plus we’ll share why we conduct a national test, and tips to help you interpret the long-awaited national reading scores.
What Is the NAEP Reading Test?
Many educators are already familiar with the NAEP test, which gives us national benchmarks for students’ academic performance in math, reading and other subjects.
Aggregated scores of the national assessment are compiled to form a report known as the Nation’s Report Card.
2024 NAEP Reading Results
Reading results for both 4th and 8th grade were 2 points lower than those in 2022 and 5 points lower than 2019. Here’s how they break down by grade level.
Average 4th Grade Reading Results
The NAEP 4th grade reading scores for 2024 represent the average results for 117,400 students across 6,100 school districts nationwide.
The students who took the test were in 4th grade during the 2023-24 school year, which means they were kindergartners when the pandemic began. Many of these 4th graders also experienced disruptions to their education in 1st grade, a crucial year for developing early reading skills.
- 31 percent of 4th graders scored at or above NAEP Proficiency
- 40 percent of 4th graders scored below Basic Proficiency
- 69 percent of 4th graders are reading below proficiency levels
- 2 in 5 of our 4th graders are reading below the most basic level
- 4th graders attending schools in city, suburban, and rural locations all scored lower in 2024 than 2022
- Louisiana was the only state in the nation to record 4th grade reading growth

Average 8th Grade Reading Results
The 2024 8th grade reading results represent the average scores of 114,600 from 5,400 school districts across the United States.
- 33 percent of 8th graders scored at or above NAEP Proficiency
- 1 in 3 8th graders performed below NAEP basic proficiency — the most in NAEP history
- The most significant drop in scores was seen among Hispanic 8th graders who
A Brief History of NAEP
To truly understand the significance of testing reading achievement on a national scale, we have to go back some 60 years.
Today’s NAEP test is the brainchild of Francis Keppel, a former dean of the Harvard Graduate School of Education who was appointed as U.S. commissioner of education by President John F. Kennedy in 1962. According to a history of the test, when Keppel arrived in Washington, D.C., he researched his new role and learned that his office was responsible for providing an annual report to Congress on student progress, something that had never actually been done before.
Keppel was already working with the Institute for Advanced Studies in the Behavioral Sciences to create a means for measuring student achievement when President Lyndon Johnson signed the Civil Rights Act of 1964, which called for a report on the Equality of Education Opportunity to be delivered on July 1, 1966.
The precursor to NAEP — the Equality of Educational Opportunity Survey (EEOS) — was rushed out in 1965, testing students in grades 1, 3, 6, 9, and 12 on a variety of measures.
Four years later, the first NAEP assessment was completed in the spring of 1969. That test measured 17-year-olds on their understanding of citizenship, science, and writing, and it was followed up later in the year with an assessment administered to 9- and 13-year-old students and out-of-school 17-year-olds.
The Education Commission of the States (ECS) — a non-profit organization of state leaders — was given responsibility for conducting the national test and continued to do so periodically up until the 1980s.
NAEP Today
Today’s national testing is administered by the National Assessment Governing Board, an independent, bipartisan group appointed by the U.S. secretary of education.
Assessments are split into two threads:
Main NAEP
- Administered to a nationally representative sample of students in grades 4, 8, and 12
- Assesses student performance in a variety of subjects, including reading, math, writing, civics, science, and U.S. history
- Required for a representative sample of 4th and 8th graders in every state as a qualifier for federal education aid
- Conducted every two years
- Used to create the Nation’s Report Card, a compilation of the bi-annual Main NAEP results that’s mandated by Congress
Long-Term Trends NAEP
- Administered to a nationally representative sample of 9-, 13-, and 17-year-old students
- Conducted every four years
- Measures basic reading and mathematics skills
- Designed to gauge how student performance has changed over time, dating back to the 1970s
- Reported as scale scores (on 0 to 500 scales in mathematics and reading)
- Shows the percentages of students attaining performance levels that correspond to five points on the scale (150, 200, 250, 300, and 350)
No single student takes an entire NAEP assessment. Each student chosen to take either the Main NAEP or the Long-Term Trends NAEP answers only a sample of questions in up to two subject areas.
See how a NAEP change could boost America’s 4th grade reading scores.
How to Interpret the Main NAEP Scores
The NAEP achievement levels that are included in each edition of the Nation’s Report Card show how students are performing against a set performance standard for their grade and subject area. These standards are set by the National Assessment Governing Board, measuring what students actually know and do against what they’re expected to know and do.
Results are reported as percentages of students performing below, at, or above those standards.
Main NAEP Achievement Levels
- NAEP Basic Achievement Level — To attain NAEP Basic Achievement, students have to show partial mastery of prerequisite knowledge and skills that are fundamental for performance at the NAEP Proficient level.
- NAEP Proficient Achievement Level — NAEP Proficient represents the goal for what all students at a particular grade level should know. Students who attain this level have demonstrated competency over challenging material, including subject-matter knowledge, application of such knowledge to real-world situations, and analytical skills.
- NAEP Advanced Achievement Level — Achieving the highest achievement level means students have shown superior performance.

Main NAEP Scale Scores
While achievement levels measure student performance against a benchmark, the numbered scale scores represent how well students perform on the assessment overall.
Reported scale scores are aggregated, and student group data is made available, which allows for performance comparison from region to region and across various demographics.
- Average scores are reported on a 0 to 500 scale for 4th and 8th grade reading and math, as well as for 12th grade history and geography.
- A 0 to 300 scale is used for scoring science, writing, civics, and 12th-grade mathematics.
- Each scale is broken into five percentiles to establish students’ performance in relation to their peers:
- Lower-performing students (at the 10th and 25th percentiles)
- Middle-performing students (at the 50th percentile)
- Higher-performing students (at the 75th and 90th percentiles)

2024 National Assessment of Educational Progress Changes
Changes You Don’t See: Foundational Reading Skills
Although “Basic” is the lowest of the three main achievement levels reported, 40 percent of 4th graders performed below that basic level in 2024, continuing a long-term trend (the number was 37 percent in 2022).
The NAEP Oral Fluency study conducted in 2018 revealed one major cause of the problem – students performing below the NAEP Basic level often have not yet developed the foundational skills necessary for fluent oral reading and comprehension.
The study’s authors suggested “additional testing of fourth-grade students’ oral reading fluency and foundational skills with a subsample of the students who take the main NAEP reading assessment. Such testing would provide much needed information about the students who are performing below NAEP Basic.”
Despite this, nothing was changed on the 2024 Main NAEP test to measure students’ foundational reading skills.
The reading assessment conducted was based on the same testing framework used since 2009 and measured only students’ reading comprehension and their ability to apply vocabulary knowledge to assist them in comprehending what they read.
Foundational skills were not addressed, the test creators said, because, “By grade 4, when the NAEP Reading Assessment is first administered, students should have a well-developed understanding of how sounds are represented alphabetically and should have had sufficient practice in reading to achieve fluency with different kinds of texts.”
Ironically, the trends show that’s not happening — students are scoring well below proficient because they don’t have this well-developed understanding.
Changes You Will See: New Poverty Measures
The Nation’s Report Card has traditionally provided insight into the connections between poverty and student achievement through reporting of the students’ eligibility for free or reduced-price lunch.
A new composite measure of socioeconomic status will appear on the national assessment report in 2025, based on the following components:
- A student’s eligibility for school meals and other federal safety-net programs, such as Temporary Assistance to Needy Families
- The total share of students eligible for income-related programs at the school
- The number of printed books in the student’s home
- For grades 8 and 12, the education level of either parent (Fourth graders have not been able to identify their parents’ education consistently.)
More Assessment Resources for Educators
Want to learn more about the national assessments? Explore these helpful resources:
- NAEP Data in Focus — This database from the American Institute for Research covers a broad range of NAEP data analysis findings dating back to 2016.
- 2026 Reading Framework — Discover the updated testing framework which will be used to assess students’ reading skills the next time kids sit down to take a Main NAEP test.
- NAEP State Profiles — See how students in your state have performed on past NAEP assessments.


